SOS_SCHEDULER_YIELD is a common wait type which often puzzles DBAs. It does not necessarily mean something is "problematic", rather it tells that SQL Server workers are voluntarily yielding the CPU to let other threads run. However, when this wait becomes dominant, it is usually a signal that the CPU is under pressure or certain queries are consuming more CPU cycles than they should.
In this guide, we will walk through what SOS_SCHEDULER_YIELD means, why it occurs, how to identify the queries contributing to it, and practical steps to mitigate CPU contention in your SQL Server environment. Let's start.

Figure-2:- SOS_SCHEDULER_YIELD Wait Type
SOS_SCHEDULER_YIELD
SQL Server uses a special way to manage CPU time called a co-operative, non-preemptive scheduler. This means a query runs for a short time (about 4 milliseconds), then voluntarily gives up the CPU so another task can run. When this happens, SQL Server marks it with the SOS_SCHEDULER_YIELD wait type. This type of wait does not mean the task is waiting for a resource like disk or memory. It just means the task is waiting for its turn to run again. That is why you will not see it in the sys.dm_os_waiting_tasks DMV.
Simulating SOS_SCHEDULER_YIELD Type
Let's simulate the SOS_SCHEDULER_YIELD wait type by executing below query using SQLQueryStress tool on AdventureWorks2022 database.
-- Clear the DMV. Be cautious about clearing DMV in production environment.
DBCC SQLPERF ('sys.dm_os_wait_stats', CLEAR);
GO

-- Create this function.
CREATE OR ALTER FUNCTION dbo.HeavyCPU(@input INT)
RETURNS BIGINT
AS
BEGIN
    DECLARE @i INT = 0, @result BIGINT = 0;
    WHILE @i < 10000
    BEGIN
        SET @result += (@input * @i) % 7;
        SET @i += 1;
    END
    RETURN @result;
END;
GO

-- Execute this through SQLQueryStress tool
SELECT
    p.BusinessEntityID,
    dbo.HeavyCPU(p.BusinessEntityID) AS CPU_Burn,
    p.FirstName,
    p.LastName
FROM Person.Person AS p
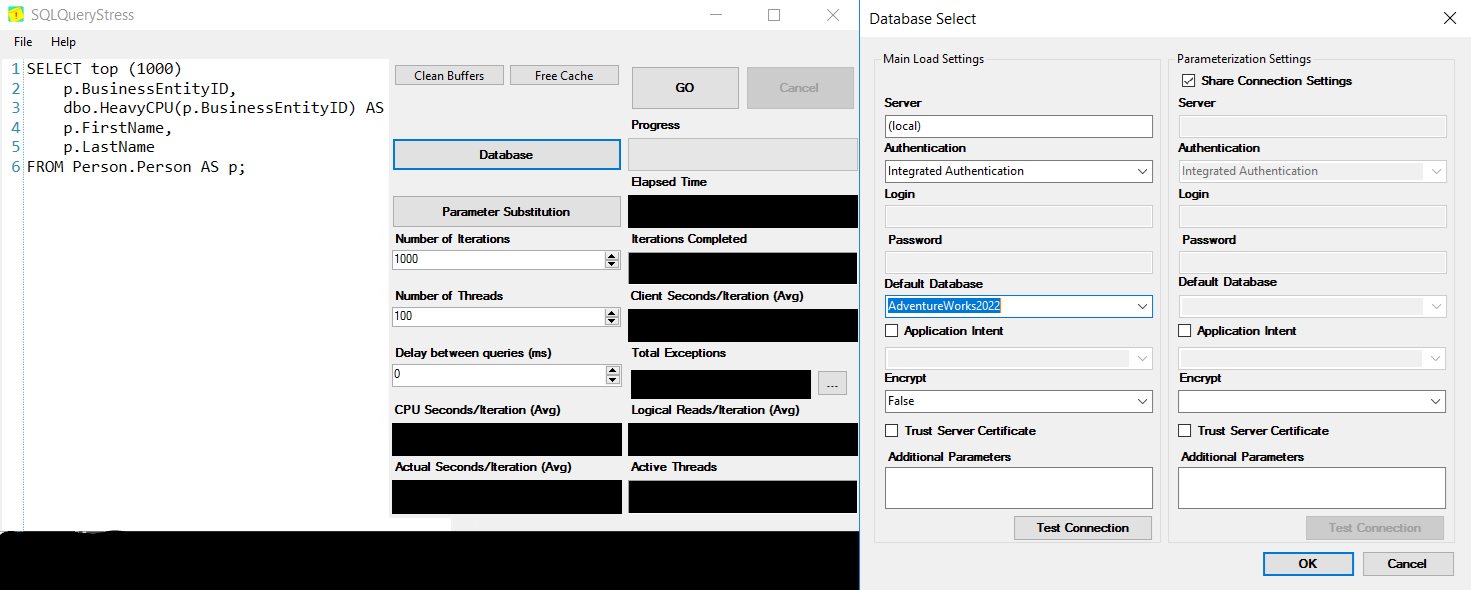
Figure-2:- Simulation using SQLQueryStress
Identifying SOS_SCHEDULER_YIELD Wait Type
Now run Paul Randal's query in SSMS to identify the top wait types of your server. The output will similar to Figure-3.

Figure-3:- SOS_SCHEDULER_YIELD wait type in Top Wait list
Finding out CPU Pressure
If the signal wait time is a big part of the total wait time, it indicates CPU pressure. For SOS_SCHEDULER_YIELD wait type has almost 0 wait for other resources. It waits in runnable queue, so signal wait type will be significant. Below query will display the total signal wait time and percentage signal wait time of total time (Figure-4).
SELECT
SUM(signal_wait_time_ms) AS TotalSignalWaitTime,
( SUM(CAST(signal_wait_time_ms AS NUMERIC(20, 2)))/ SUM(CAST(wait_time_ms AS NUMERIC(20, 2))) * 100 ) AS PercentageSignalWaitsOfTotalTime
FROM sys.dm_os_wait_stats

Figure-4:- Signal Wait time
Validating CPU Pressure
If the signal wait shows signs of CPU pressure, you can use a DMV called sys.dm_os_schedulers to double-check to verify SQL Server is CPU-bound. This view shows details for each SQL Server scheduler. It tells you:
- How many total tasks are assigned.
- How many of those tasks are runnable (i.e., ready and waiting to use the CPU).
SELECT scheduler_id, current_tasks_count, runnable_tasks_count, work_queue_count, pending_disk_io_count
FROM sys.dm_os_schedulers
WHERE scheduler_id < 255
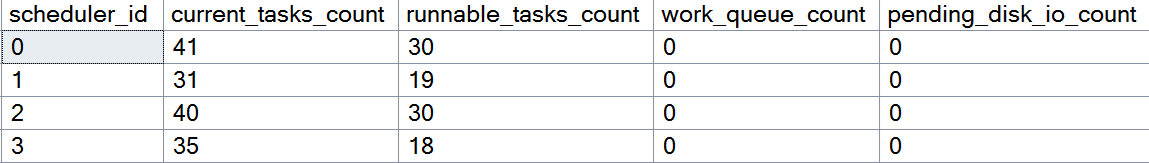
Figure-5:- Validate CPU Pressure by Querying Scheduler Queues
If the number of runnable tasks is high for each scheduler, it usually means there is CPU pressure. Many tasks are ready but waiting for CPU time. A continuous double digit number in runnable_tasks_count for long time (not once in a while) signals about CPU pressure.
Top CPU-Intensive Queries
Below query will help you to find out top 10 queries those made the server busy as shown in Figure-6. This query will also reveal the execution plans. Click on the execution plans and optimize them.
SELECT TOP 10
    COALESCE(DB_NAME(st.dbid),DB_NAME(CONVERT(INT, qp.dbid))) AS [DatabaseName],
    qs.creation_time AS [PlanCreationTime],
    qs.last_execution_time AS [LastExecutedTime],
    SUBSTRING(st.text,(qs.statement_start_offset / 2) + 1,((CASE qs.statement_end_offset WHEN -1 THEN DATALENGTH(st.text) ELSE qs.statement_end_offset END - qs.statement_start_offset) / 2) + 1) AS [QueryText],
    qs.execution_count AS [ExecutionCount],
    qs.total_worker_time / 1000 AS [Total_CPU_Time_ms],
    (qs.total_worker_time / qs.execution_count) / 1000 AS [Avg_CPU_Time_ms],
    (qs.total_worker_time / 1000) AS [Cumulative_CPU_Time_All_Executions_ms],
    (qs.total_logical_reads + qs.total_logical_writes) AS [TotalLogicalIO],
    (qs.total_logical_reads + qs.total_logical_writes) / qs.execution_count AS [AvgLogicalIO],
    qp.query_plan AS [ExecutionPlan]
FROM sys.dm_exec_query_stats AS qs
CROSS APPLY sys.dm_exec_sql_text(qs.sql_handle) AS st
CROSS APPLY sys.dm_exec_query_plan(qs.plan_handle) AS qp
WHERE COALESCE(DB_NAME(st.dbid),DB_NAME(CONVERT(INT, qp.dbid))) NOT IN ('master', 'model', 'msdb', 'tempdb')
ORDER BY qs.total_worker_time DESC;

Figure-6:- Top CPU consuming queries
Reasons of SOS_SCHEDULER_YIELD Wait Type
SOS_SCHEDULER_YIELD is a common wait type. The common contributors are:
- Misconfigured MAXDOP can causes this wait type. For example, assigning MAXDOP = 1 for troubleshooting excessive CXPACKET waits can lead to SOS_SCHEDULER_YIELD wait type.
- Spinlock is one of the reasons for excessive SOS_SCHEDULER_YIELD.
- Table/index scan on a table with huge volume of data.
- Outdated statistics may produce suboptimal plan causing heavy CPU usage.
- SQL Server is really starving from CPU.
Some Scenarios
There are some scenarios when you should pay attention to SOS_SCHEDULER_YIELD and in other scenarios you can ignore it. For example:
- SOS_SCHEDULER_YIELD is high and signal wait time is low - It dictates that many threads are actively running on the scheduler, all with equal priority. No single thread is dominating CPU usage. In this scenario, ignore the SOS_SCHEDULER_YIELD wait and inspect other performance issues.
- SOS_SCHEDULER_YIELD is low and signal wait time is high - It suggest that a few threads are waiting for CPU time. That means problem is external, not in SQL Server. May be some other applications acquire the CPU. Even power management feature may be on which could slow down CPU frequency.
- Both SOS_SCHEDULER_YIELD and signal wait time are high - CPUs are in stress due to CPU intensive queries. Check execution plan, table/index scan, data conversion. Sometimes, you may need to add CPU.
Final Words
A high SOS_SCHEDULER_YIELD wait does not necessarily mean your server has a CPU bottleneck. Balanced indexing, accurate statistics, and well-tuned query design often make the biggest difference. Ultimately, effective diagnosis of SOS_SCHEDULER_YIELD ensures that SQL Server spends its CPU time on truly meaningful work.
References
Going Further
If SQL Server is your thing and you enjoy learning real-world tips, tricks, and performance hacks—you are going to love my training sessions too!
Need results fast? I am also available for 1-on-1 consultancy to help you troubleshoot and fix your database performance issues.
Let’s make your SQL Server to take your business Challenge!
For any queries, mail to mamehedi.hasan[at]gmail.com.